Introduction
Air is a tangible material substance and as a result has mass. Any object with mass is influenced by the universal force known as gravity. Newton's Law of Universal Gravitation states: any two objects separated in space are attracted to each other by a force proportional to the product of their masses and inversely proportional to the square of the distance between them. On the Earth, gravity can also be expressed as a force of acceleration of about 9.8 meters per second per second. As a result of this force, the speed of any object falling towards the surface of the Earth accelerates (1st second - 9.8 meters per second, 2nd second - 19.6 meters per second, 3rd second - 29.4 meters per second, and so on.) until terminal velocity is attained.
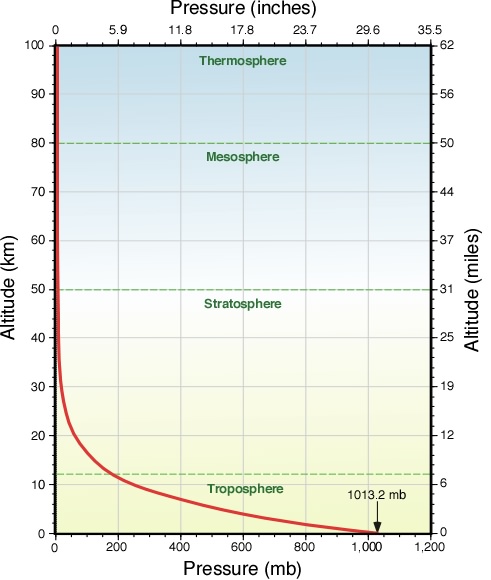
Gravity shapes and influences all atmospheric processes. It causes the density and pressure of air to decrease exponentially as one moves away from the surface of the Earth. Figure 7d-1 below models the average change in air pressure with height above the Earth's surface. In this graph, air pressure at the surface is illustrated as being approximately 1013 millibars (mb) or 1 kilogram per square centimeter of surface area.

Figure 7d-1: Change in average atmospheric pressure with altitude.
Measuring Atmospheric Pressure
Any instrument that measures air pressure is called a barometer. The first measurement of atmospheric pressure began with a simple experiment performed by Evangelista Torricelli in 1643. In his experiment, Torricelli immersed a tube, sealed at one end, into a container of mercury (see Figure 7d-2 below). Atmospheric pressure then forced the mercury up into the tube to a level that was considerably higher than the mercury in the container. Torricelli determined from this experiment that the pressure of the atmosphere is approximately 30 inches or 76 centimeters (one centimeter of mercury is equal to 13.3 millibars). He also noticed that height of the mercury varied with changes in outside weather conditions.
Torricelli's Barometer
Figure 7d-2: Diagram showing the construction of Torricelli's barometer.
The most common type barometer used in homes is the aneroid barometer (Figure 7d-3). Inside this instrument is a small, flexible metal capsule called an aneroid cell. In the construction of the device, a vacuum is created inside the capsule so that small changes in outside air pressure cause the capsule to expand or contract. The size of the aneroid cell is then calibrated and any change in its volume is transmitted by springs and levers to an indicating arm that points to the corresponding atmospheric pressure.

Figure 7d-3: Aneroid barometer.
For climatological and meteorological purposes, standard sea-level pressure is said to be 76.0 cm or 29.92 inches or 1013.2 millibars. Scientists often use the kilopascal (kPa) as their preferred unit for measuring pressure. 1 kilopascal is equal to 10 millibars. Another unit of force sometimes used by scientists to measure atmospheric pressure is the newton. One millibar equals 100 newtons per square meter (N/m2).
Atmospheric Pressure at the Earth's Surface
Figure 7d-4 describes monthly average sea-level pressure for the Earth's surface. This animation indicates that surface air pressure varies both spatially and temporally. During the winter months (December to February), areas of high pressure develop over central Asia (Siberian High), off the coast California (Hawaiian High), central North America (Canadian High), over Spain and northwest Africa extending into the subtropical North Atlantic (Azores High), and over the oceans in the Southern Hemisphere at the subtropics. Areas of low pressure occur just south of the Aleutian Islands (Aleutian Low), at the southern tip of Greenland (Iceland Low), and latitudes 50 to 80° South.
During the summer months (June to August), a number of dominant winter pressure systems disappear. Gone are the Siberian High over central Asia and the dominant low pressure systems near the Aleutian Islands and at the southern tip of Greenland. The Hawaiian and Azores High intensify and expand northward into their relative ocean basins. High pressure systems over the subtropical oceans in Southern Hemisphere also intensity and expand to the north. New areas of dominant high pressure develop over Australia and Antarctica (South Polar High). Regions of low pressure form over central Asia and southwest Asia (Asiatic Low). These pressure systems are responsible for the summer monsoon rains of Asia.
We will examine this graphic again in topic 7p when global circulation is discussed.
|
Figure 7d-4: Monthly average sea-level pressure and prevailing winds for the Earth's surface, 1959-1997. Atmosphere pressure values are adjusted for elevation and are described relative to sea-level. The slider at the bottom of the image allows you change the time of month. 05/07/2009 10:08color shading. Blue shades indicate pressure lower than the global average, while yellow to orange shades are higher than average measurements. (Source: Climate Lab Section of the Environmental Change Research Group, Department of Geography, University of Oregon - Global Climate Animations). (To view this animation your browser must have Apple's QuickTime plug-in. The QuickTime plug-in is available for Macintosh and Windows operating system computers and can be downloaded FREE from the World Wide Web site www.apple.com/quicktime). |